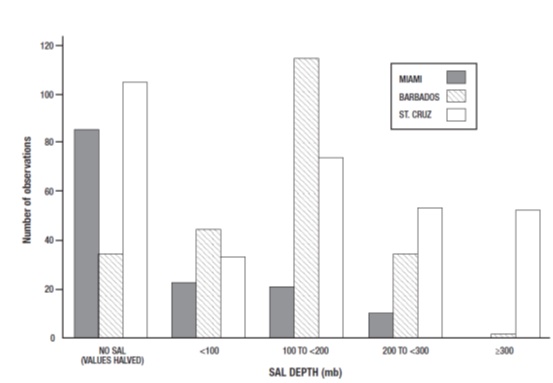
Fig. (8)
Histogram for the three sites showing frequency of SAL depth observations in different depth intervals.