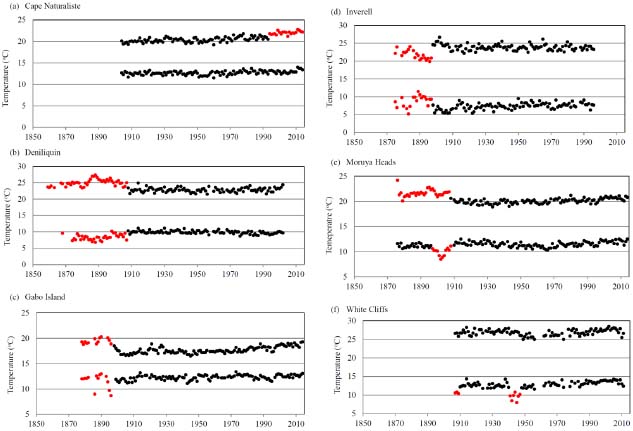
Fig. (2)
The average minimum and maximum annual temperature data are plotted for various stations. The red points are suspect as is discussed in the text.