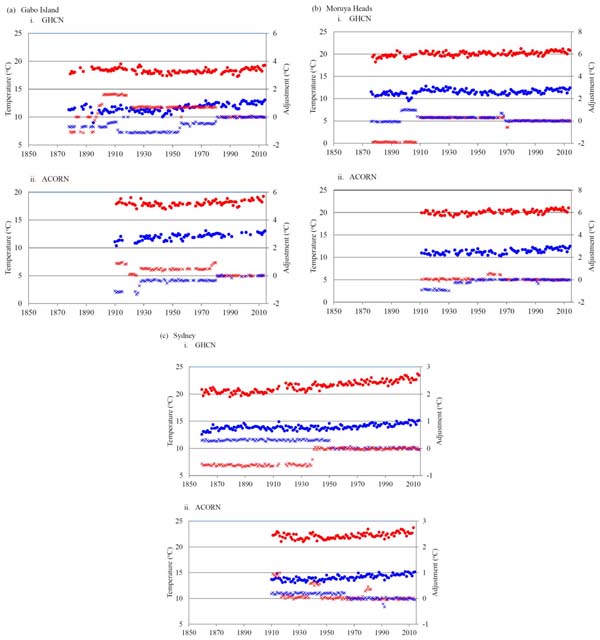
Fig. (7)
GHCN and ACORN Data for (
a
) Gabo Island (
b
) Moruya Heads and (
c
) Sydney showing minimum (blue dots) and maximum (red dots) annual temperatures obtained by adding the adjustments (crosses) to the raw data.