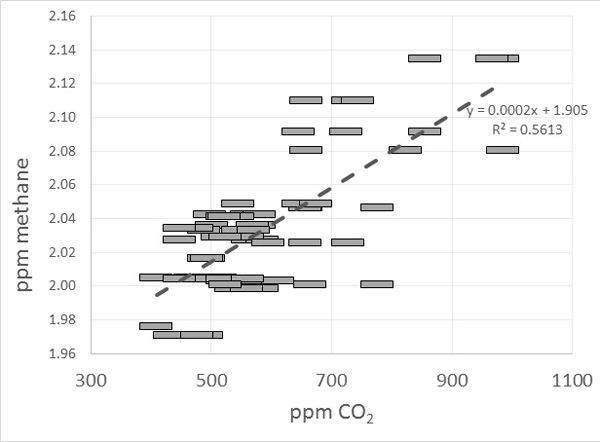
Fig. (3)
Methane-CO2 correlation in heavy car traffic. Symbol size represents the respective precision of the methane and carbon dioxide measurements. The molar emission ratio of approximately 2×10⁻⁴ (±25%) was reproducible between heavy traffic events.