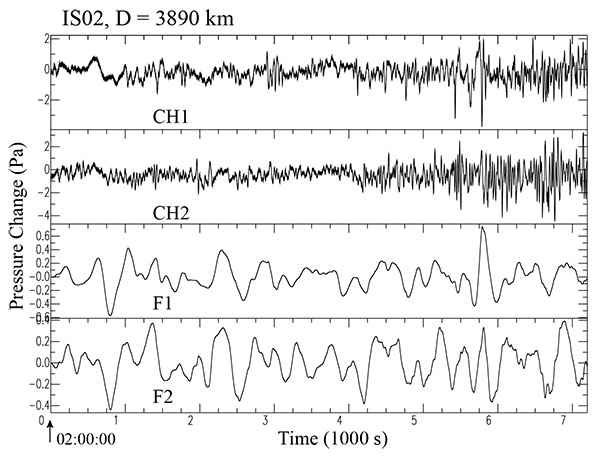
Fig. (4)
An example of the recorded and filtered waveforms of pressure perturbation during the time (02:00-04:00) at an IMS station IS02 after the 2014 Iquique earthquake. The upper two traces (CH1 and CH2) provides the original records of pressure perturbation for the time interval of 7, 200 sec (the initial time indicated at the lowest left end), before and after the arrival of target atmospheric signals. The lower two traces (F1 & F2) are their filtered waveforms for the period range between 14 min and 4.5 min (or between 1.19 and 3.70 mHz) (See Chapter 3).