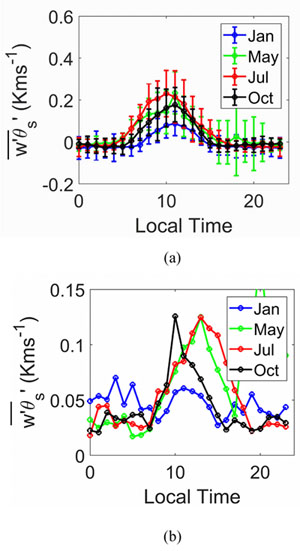
Fig. (2)
Mean and variability of surface heat flux at different hours for different months using NREL data. (
a
) shows the mean and one standard deviation error bars (
b
) shows the standard deviation.