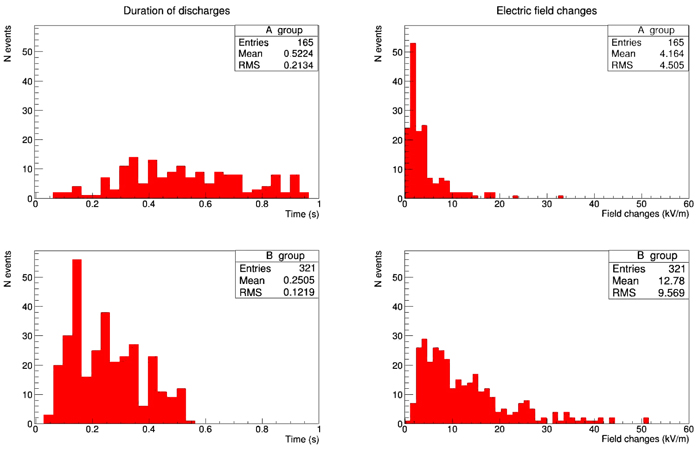
Fig. (5)
Histograms of the period from the start of the electric field sharp decrease (increase) to its minimum (maximum) (1) an (3) and histograms of electric field changes (absolute value): A group (2) and B group (4).