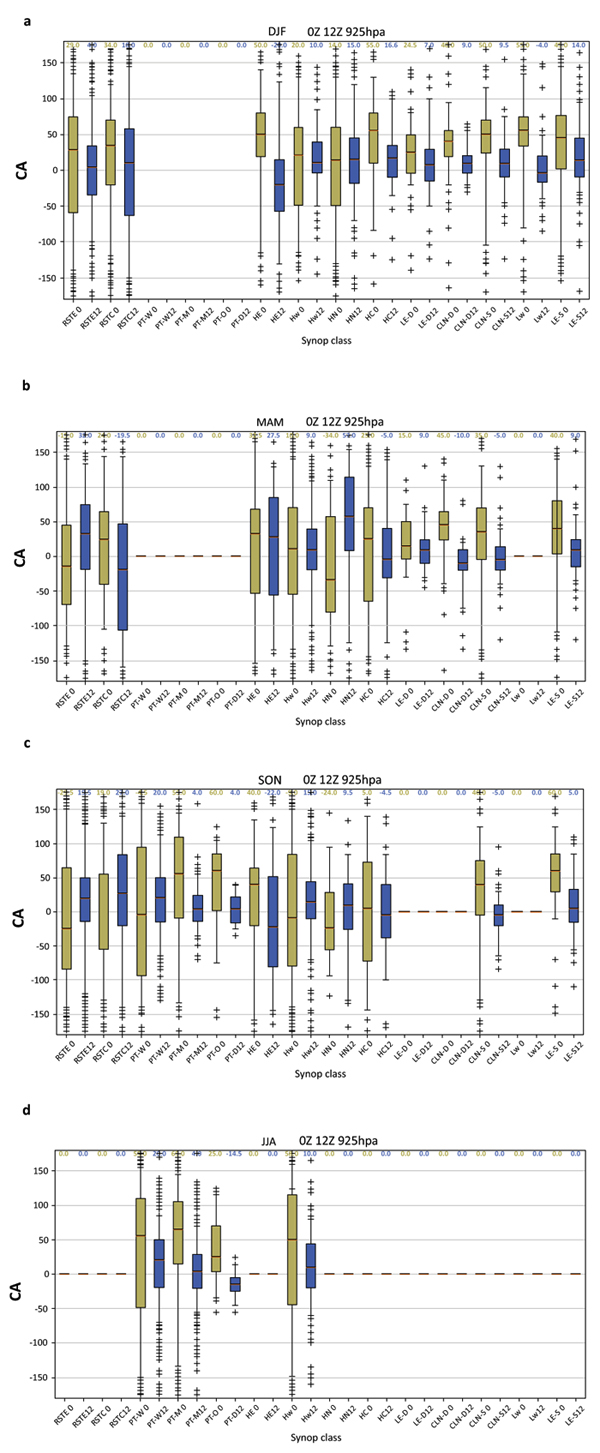
Fig. (3)
CA925 boxplots for the most frequent synoptic classes according to seasons and hours 0Z (pale green) or 12Z (light blue) a-DJF b-MAM c-SON d-JJA. Each box indicates the median and quartiles (25% 75%) of each histogram. The whiskers display the 5% and 95% values of each histogram, outliers are indicated by +. Boxplot is shown when more than 30 events were found.