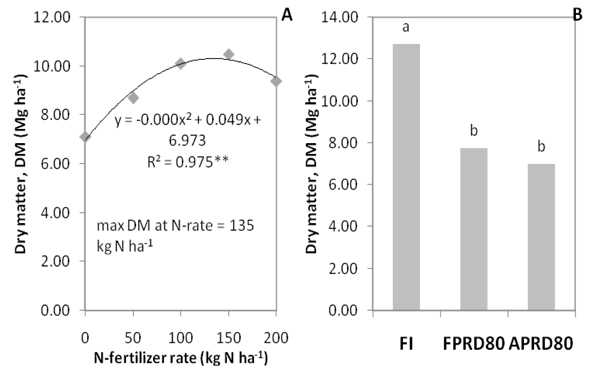
Fig. (2) Response of dry matter yield to (A) N-fertilizer rates, and (B) drip irrigation mode. For the trend comparison, regression equation, determination coefficients (R2), and associated significance level are given. ** = significant at 1% level. For the bar chart, means followed by a common letter are not significantly different at the 5 % level.`