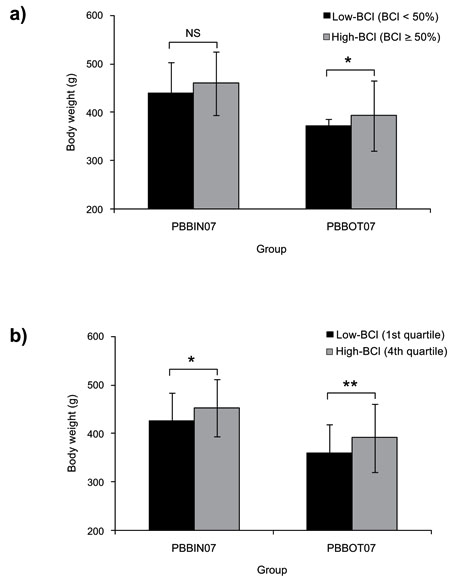
Fig. (3)
Comparison of growth performance of blue-colored groups of rainbow trout. Individuals of each group were sorted on contrasting categories base on blue color intensity on the back (BCI). a) comparison of body weight among BCI < 50% and BCI ≥ 50% categories, and b) comparison of body weight between 1st and 4th quartiles. The BCI < 50% and 1st quartile were considered a Low-BCI category, whereas BCI ≥ 50% and 4th quatile corresponded to the High-BCI category. Columns and bar errors represent means and standard deviation of means, respectively. Significant differences between means were calculated according to Student’s t-test. *P < 0.05,**P < 0.01, NS = Non-Significant Result.