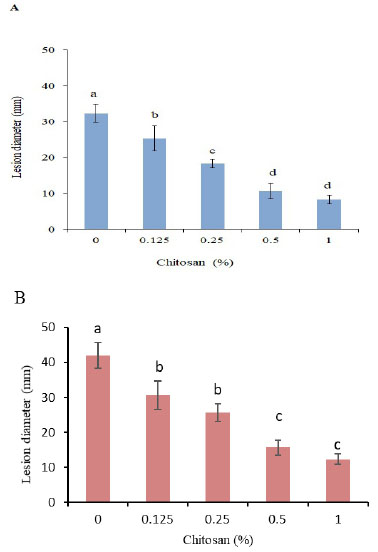
Fig. (2) Influence of chitosan at different concentrations on lesion diameters of inoculated tubers of tow cultivars. A, Kolobok. B, Cante. Data are expressed as a mean of triplicate samples (± SD). Significant differences (P> 0.05) as indicated by LSD test are shown by different letters.