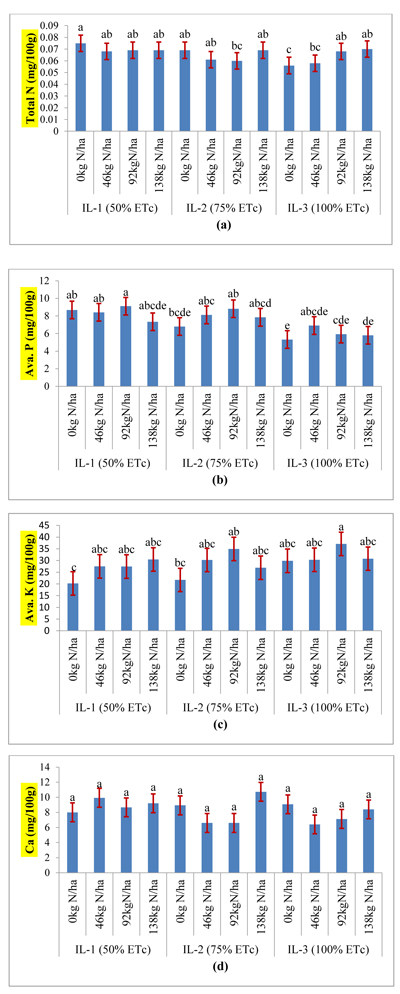
Fig. (1)
The residual effects of irrigation water and nitrogen fertilizer rates on total N (a), available P (b), available K (c) and exchangeable Ca (d). Columns with the same letter/s represent values that are not significantly different at 5% probability level. Vertical bars represent standard error of the mean.