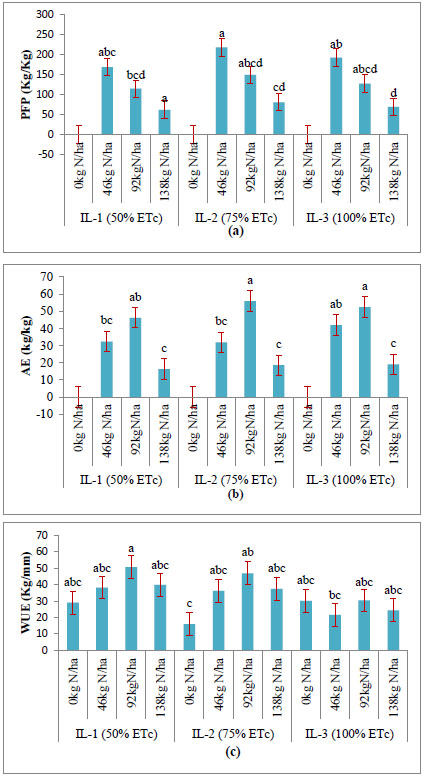
Fig. (2)
PFP (kg/kg) (a), AE (kg/kg) (b) and WUE (kg/mm) (c) as influenced by irrigation water and nitrogen fertilizer levels. Columns with the same letter/s represent values that are not significantly different at the 0.05 level of probability. Vertical bars represent standard error of the mean.