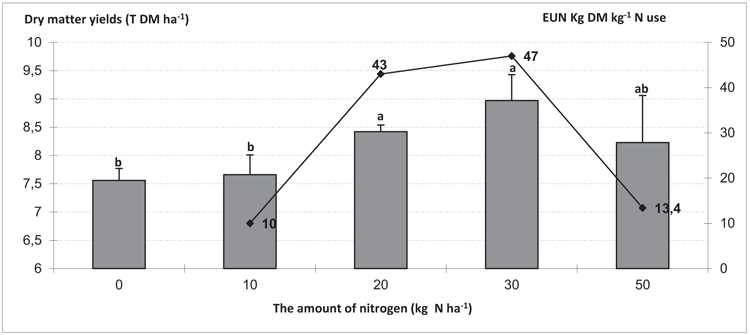
Fig. (2)
Variation in forage yield with different levels of nitrogen and nitrogen use efficiency (NUE) at zero N application. The bars at the top of each histogram represent the standard deviations. Histograms with different letters represent significantly different yields.