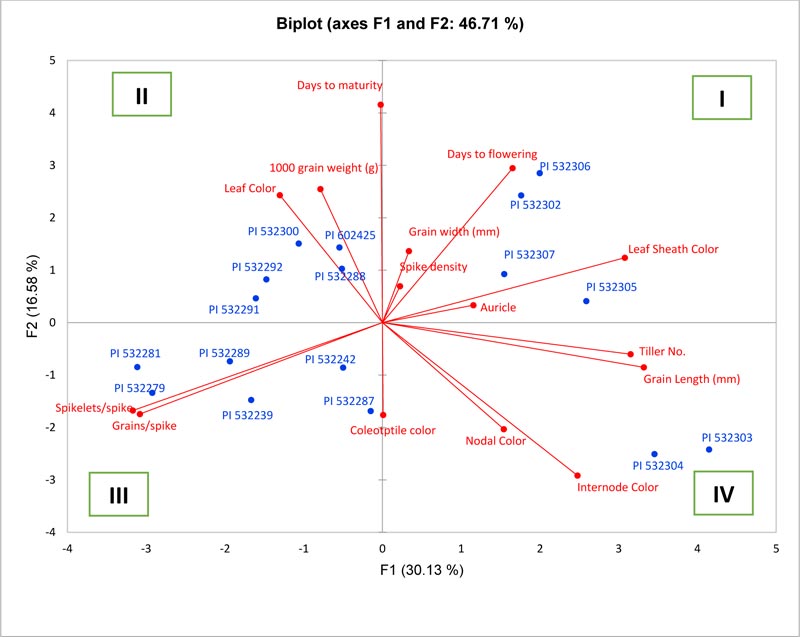
Fig. (2)
Biplot graph of PC 1(Factor 1) and PC 2 (Factor 2) showing the distribution of 17 durum wheat accessions into its four quadrants as clusters along with eigenvectors of the characters that influence the corresponding axis most.