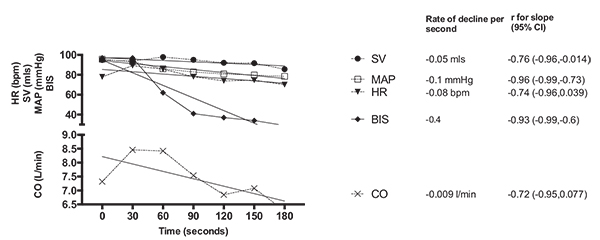
Fig. (2)
Absolute change in stroke volume (SV), mean arterial pressure (MAP), heart rate (HR), bispectral index (BIS) and cardiac output (CO) plotted against time (seconds) after induction with propofol with best fit linear regression line.