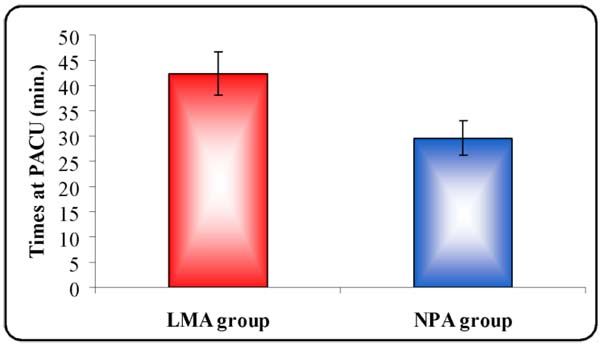
Fig. (1)
Graph comparing the time passed at the PACU between two groups. Bars represent Mean±SD.