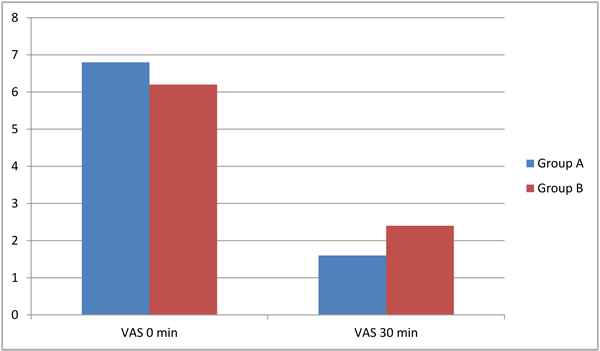
Fig. (1)
Visual Analogue Scale (VAS) in the two groups. Bars represent Mean ± SD.