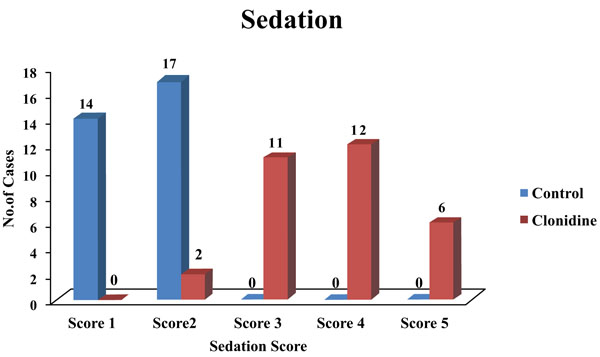
Fig. (2)
Bar diagram depicting sedation score in control and clonidine groups.