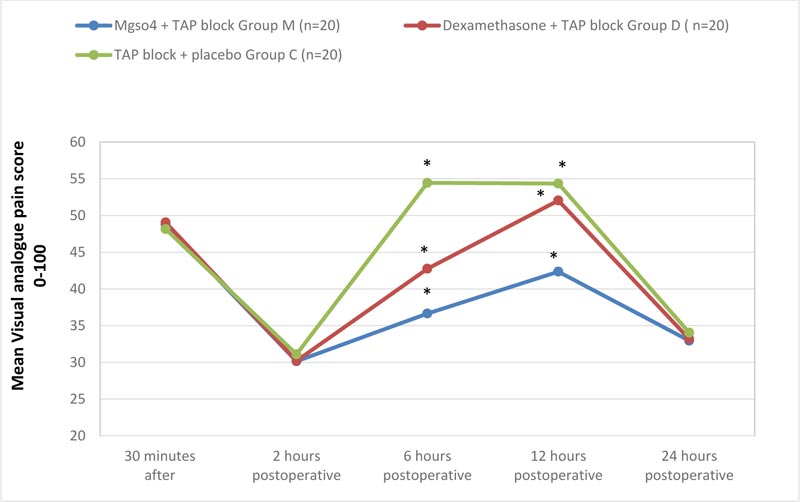
Fig. (2)
Showing the mean VAS values at different periods of follow.