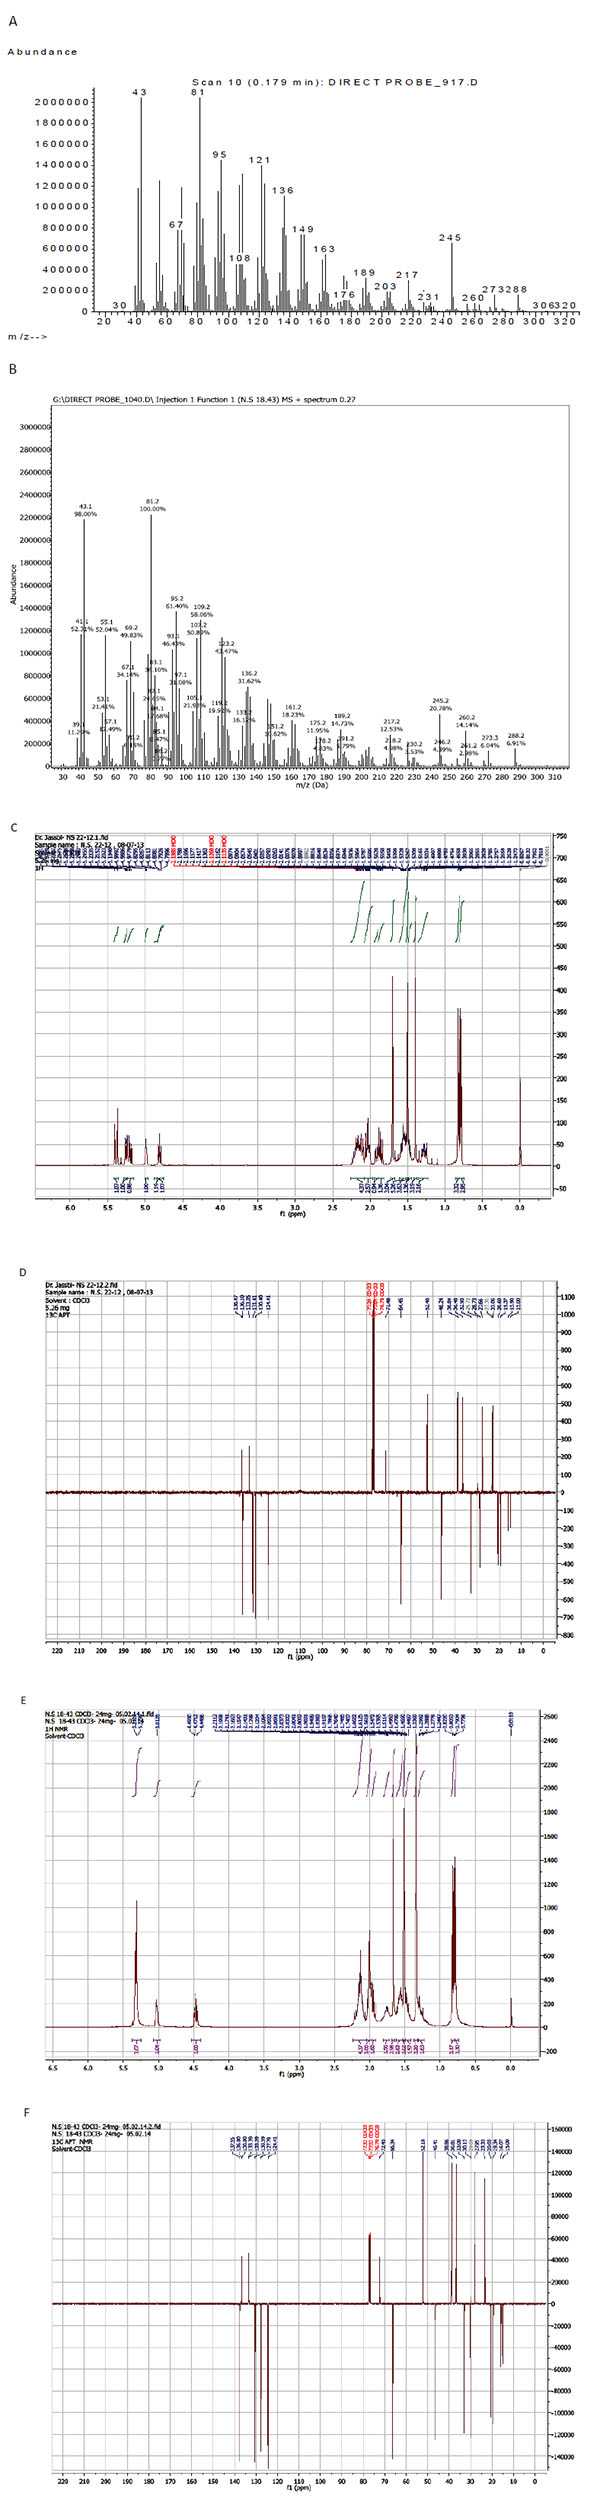
Fig. (1)
EI-MS (A and B),
1
H NMR (C and E) and
13
C NMR (D and F; 500 MHz in CDCl
3
) spectra of compounds
1
and
2
, respectively.