Fig. (1)
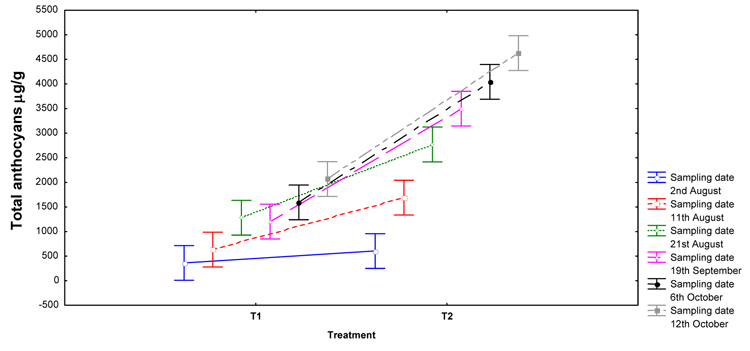
Changes in total anthocyanins concentration (μg/g of dry skins) of control (T1) and PhCO
2
treated (T2) ‘Crimson Seedless’ grapes during ripening. Values are means of four replicates and vertical bars denote 0.95 confidence intervals.