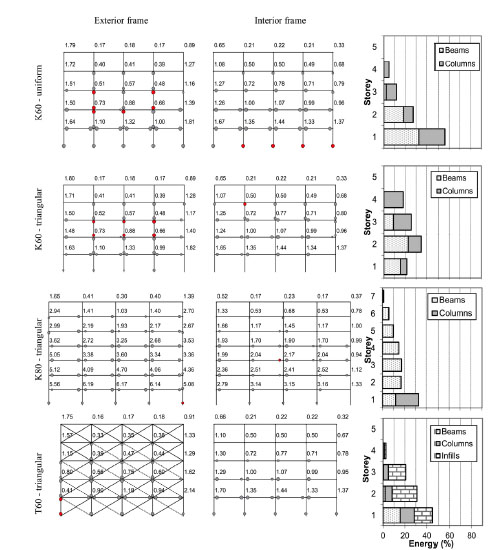
Fig. (7)
Distribution of plastic hinges and local inelastic energy absorption with height (%) for pushover analysis. Values at joints indicate the joint capacity ratios (Σ M
RC
/ Σ M
Rb
). Infills plotted in “dashed” line when cracked.