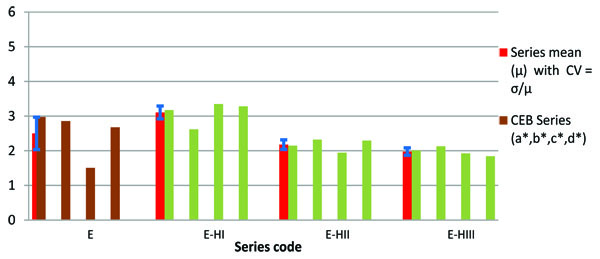
Fig. (9)
Bar chart with strengths results; each series mean value and its coefficient of variation (CV) in a blue error bar.