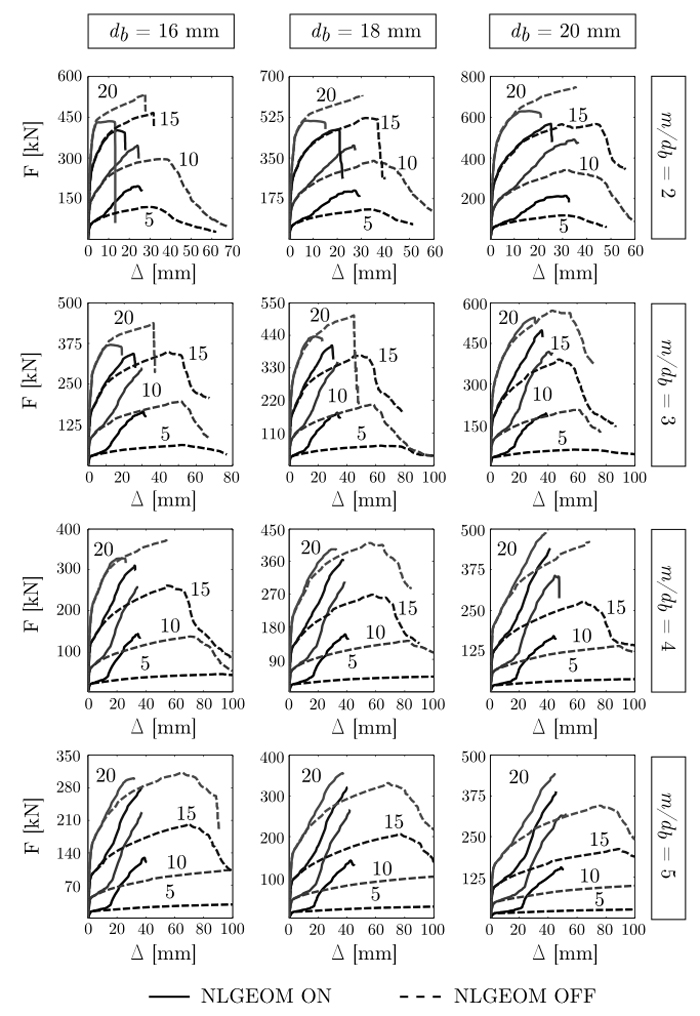
Fig. (6)
F – Δ curves predicted by the different FE models. Each column refers to a different db, whilst each row has a fixed value of m/db. Numbers on the graphs indicate the value of tf.