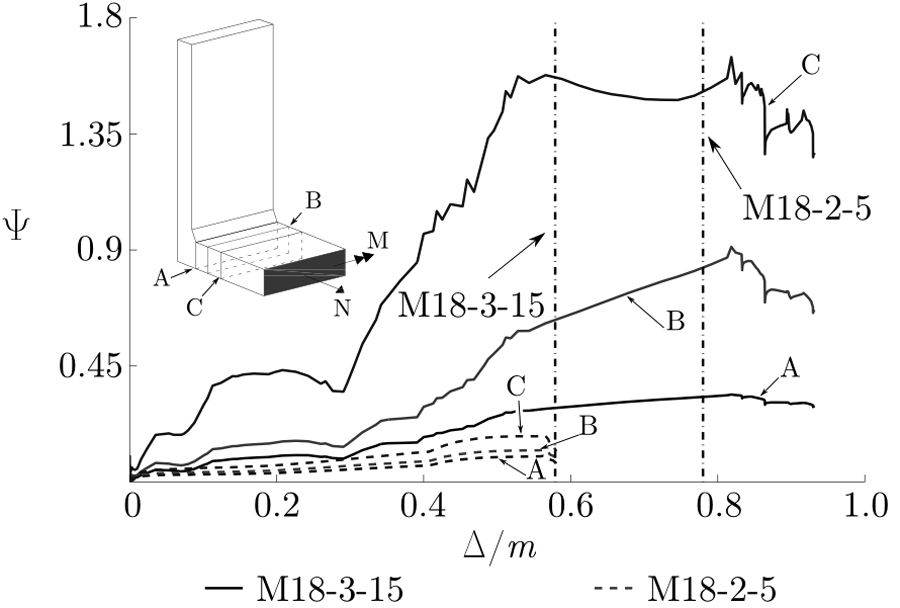
Fig. (7)
Trend of Ψ (the non-dimensional index) across three consecutive sections of the flange. Two examples are given, i.e. M18-2-5 and M18-3-15. Dash-dot lines are for Δu/m thresholds where Δu is the displacement corresponding to the peak force.