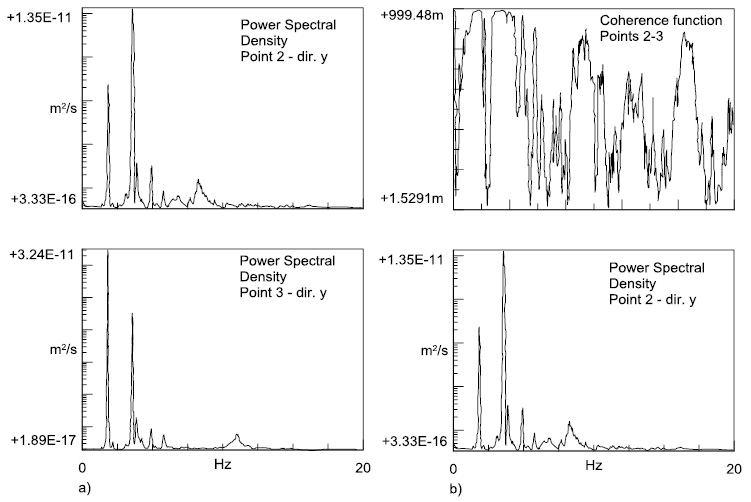
Fig. (9)
a)
Power spectral densities: points 3 and 2;
b)
Coherence function of the responses at points 3 and 2 compared to the power spectral density of the response at point 2.