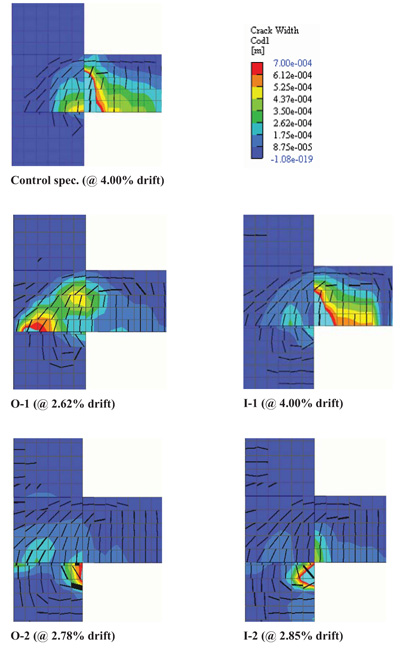
Fig. (12)
Crack width plots in the five different models (side views) at the max attained drift value.