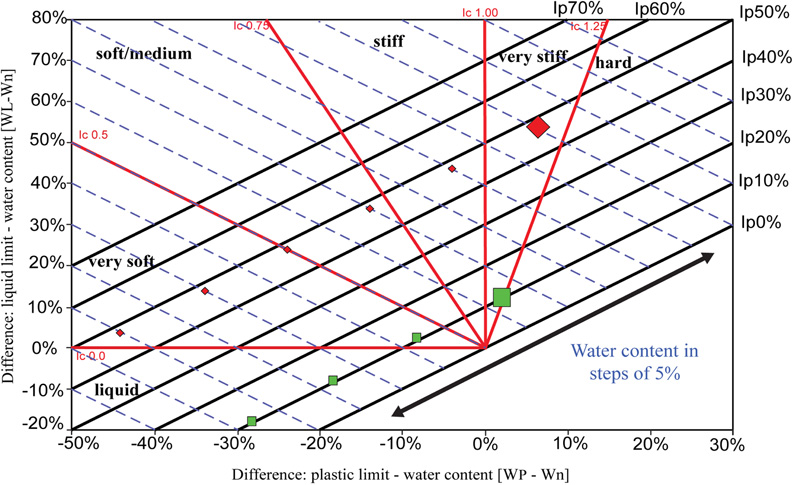
Fig. (9)
Original shape of the new diagram with a scale to estimate the water content (the distancee between two blue lines illustrates 5% of difference in terms of water content) [4].