| Method |
Statistics or Method |
| Graphical [14] |
Draw a cumulative graph of failure times (TBFs) or repair times (TTRs) by the cumulative number of failures |
| The straight line indicates no trend in data and the convex or concave curves, respectively, indicating a decrease or an increase in the failure rate. The increasing failure rate indicates the occurrence of premature failure. |
| MIL-HDBK-189 [16] |
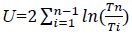 |
| If U<xc2, the assumption H0 (data have no trend) is rejected. |
| Laplace [17] |
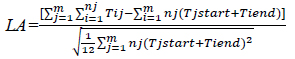 |
 , TBFs on the rise (have trend) , TBFs on the rise (have trend)
 TBFs are on the decline (have trend) TBFs are on the decline (have trend) |