| Model | Test | Statistics | Acceptance Condition H0 |
|---|---|---|---|
| stable |
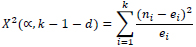
[20] Chi-square test |
 |
 |
| Kolmogorov-Smirnov test(K-S) | 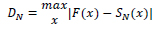 |
 |
|
| Anderson-Darling test(A-D) | 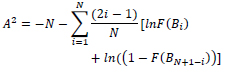 |
 |
|
| Mann-Scheuer-Fertig test | 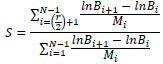 |
 |
|
| unstable | Cramer-Von-Mises test | 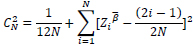 |
 |
| Drawing method | Logarithmic graph of the number of failures ln (N (tj)) compared to the cumulative time ln (tj) plotted (j failure number), if the straight line is observed the PLP model may be appropriate. | ||