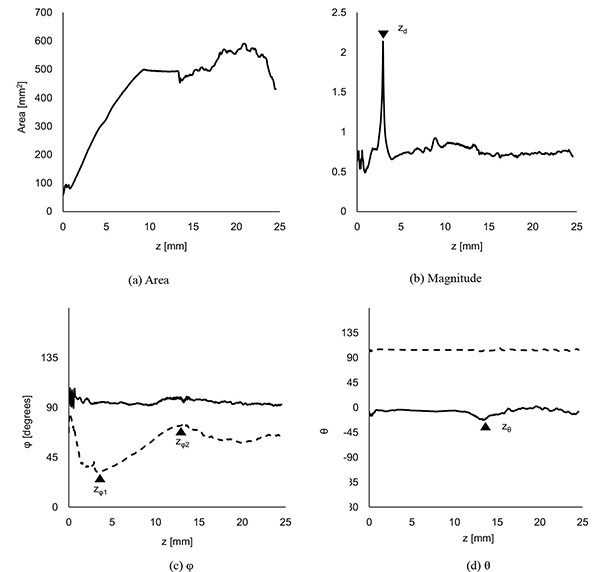
Fig. (3)
Displacement caused by the contraction of the stem villi. λ = 1.45 mm, and the maximum distance for the propagation = 4.35 mm. All the parameters at each z coordinate are shown. While (a) shows the displaced area, the magnitude (b) and direction (φ, θ) (c, d) of the displacement were described by the representative values, the mean and standard deviation (SD) for the displaced area. The solid and dotted lines in (c) and (d) are the mean and SD, respectively. The triangles show the characteristic positions, which were observed at all the computations. zd, zφ1, zφ2, and zθ are the z coordinates for these characteristic positions.