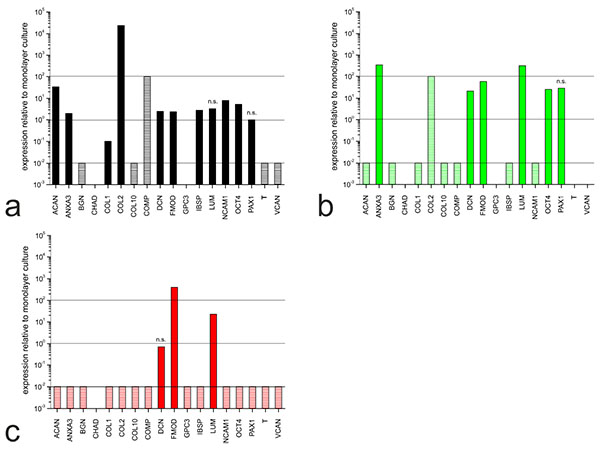
Fig. (2)
Gene expression profiles in (a) hMSC-TERT cells after 1 day in hydrogel culture, and (b) NP cells and (c) chondrocytes after 21 days in hydrogel culture, using EIF4A2 as the reference gene. Ct values were normalized to the reference gene and to the particular mRNA expression in the monolayer culture. No Ct value was available for some markers and although a precise quantification was not possible in these cases, expression changes due to culture setting are illustrated by dashed bars. Increased expression is indicated by dashed bars set to 102 (no expression in monolayer but expression detected in hydrogel culture). Decreased expression is indicated by dashed bars set to 10-2 (expression detected in monolayer but not in hydrogel culture). Empty spaces indicate no PCR products in the monolayer or hydrogel culture. All calculated relative expression levels were significant (p < 0.05) except those marked as n. s. (= not significant).