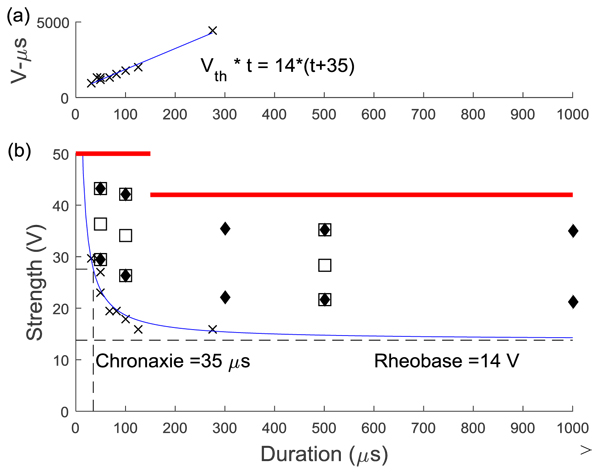
Fig. (2)
Example strength-duration curve calculation from the ulnar nerve of subject 3. (A) The product of pulse amplitude (Vth) and duration (t) was plotted against pulse duration. This linear relationship was used to calculate rheobase amplitude and chronaxie time using Equation 1. (B) Resultant strength-duration curve obtained from Equation 2 (blue) with the same threshold points plotted as ‘x’. The upper red lines are the maximum comfort level from ramping at 100 µs (left portion) and 500 µs (right portion). The filled diamonds represent the 10 pulse amplitude and duration combinations used with the upper extremity nerves and the open squares are the 9 points used for the lower extremity nerves.