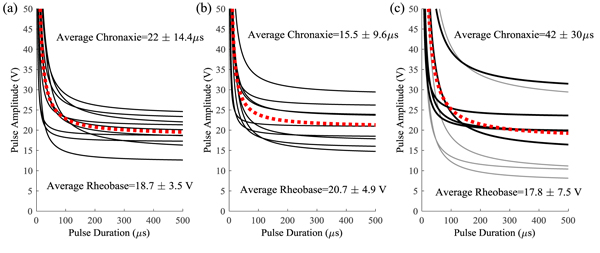
Fig. (5)
Strength duration curves from each nerve with the average plotted in the thick red dotted line. (
a
) Median nerve; (
b
) Ulnar nerve; (
c
) Lower Extremity with first 5 subjects before the protocol change plotted in gray.