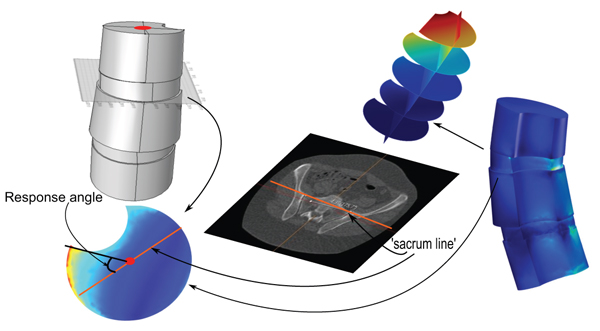
Fig. (1) Illustration of how to obtain the so called apex top response angle. Note that the very definition requires a given model (including a certain line describing the tilting and rotation of the hips relative to the scanner bed) extracted from CT, together with a given load-state for that model. This implies that one can calculate pointwise distortion energies (see the rightmost image, showing the result of such calculations for the full solid). Comsol allows for extraction of subdata corresponding to slices in the model (examples of such slices are depicted above the solid response image). For the response variable, we extract a plane parallel to a face of the apex (see lower left image). In this figure, we can find the point corresponding to the approximate relative center of mass (depicted by a red circle) in the slice, and the translation of the sacrum line (Section 3.2 regarding how to find the sacrum line) that passes that point. The apex top response angle is the angle at the aforementioned point, between the sacrum line and a line passing through the focus point, usually, this is a unique point, but in cases that it is not and where artifacts can be suspected, ad hoc choice by the investigator was used.