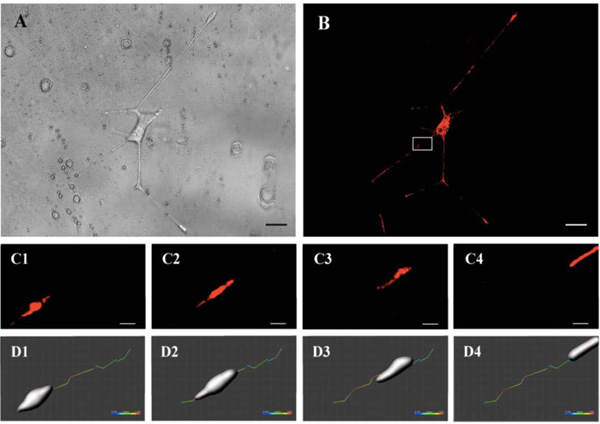
Fig. (2)
Travelling mitochondria in neurites. Panel A and B show an isolated PC12 cell as seen with bright field (A) and fluorescence (B). Scale bar 10µm (on A and B). Most of the neurites took a direction parallel to the groove. An isolated part of the neurite (White Square on B) was selected to follow and quantify movements of mitochondria (panels C). Scale bars 1µm, 15 seconds elapsing from C1 to C4. The trajectory and speed of the organelle was assessed along the time (panel D). Color bar ranging from 0.1 to 1µm/second.