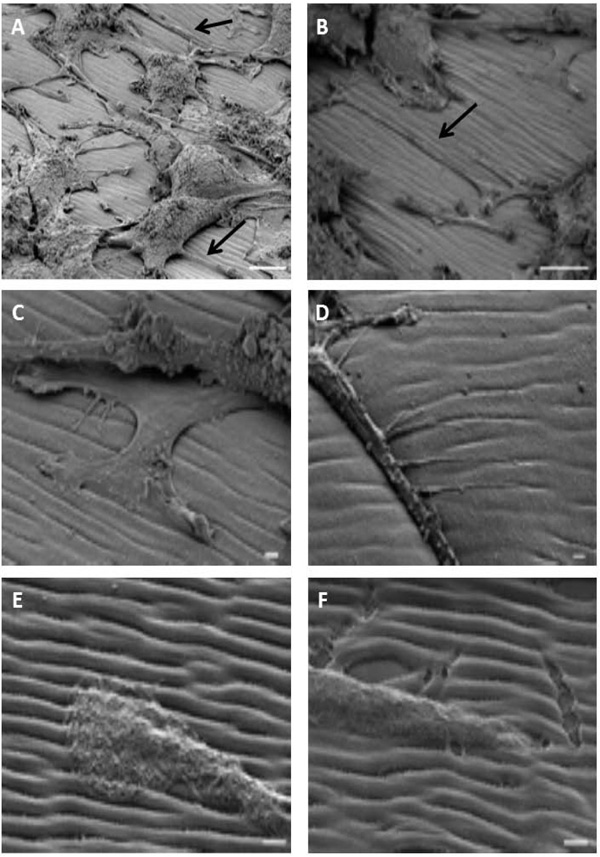
Fig. (4)
Topography measurement of the pattern before (panel E) and after the use of our protocol, confirming the preservation of the surface pattern. The pitch and amplitude of the grooves showed similar average values before and after the protocol use. SEM analysis of cells after fixation: they showed a normal cell shape body (panel A). Some of the neurites were directed along the grooves (arrows on panel A and B and panel C and D). At higher magnification, it was possible to see the intimate relationship between growth cones (panel E) and neurites (panel F). Scale bar is 10µm on A and B, 1µm on C, D, E and F.