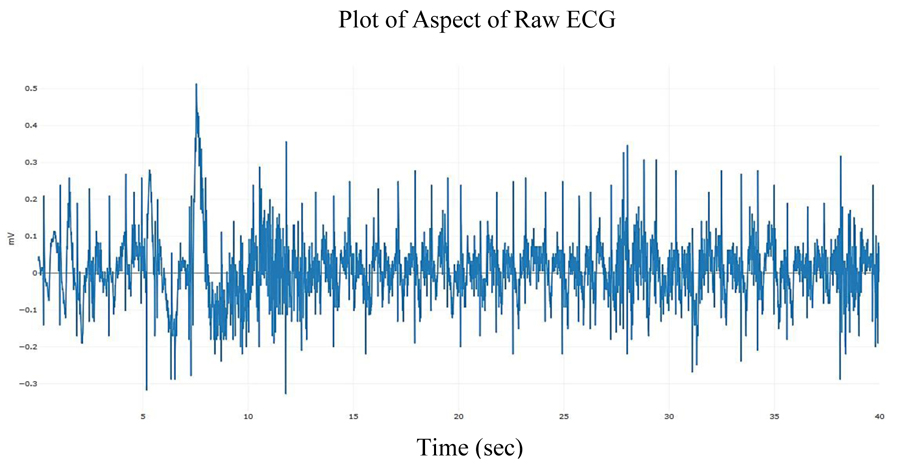
Fig. (1)
Plot of Raw ECG signal showing time varying (seconds) heart electrical activity.