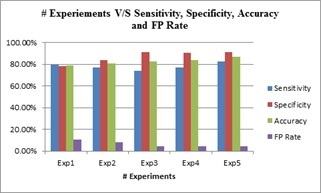
Fig. (6)
Graphical representation of the results shown in Table
2
.