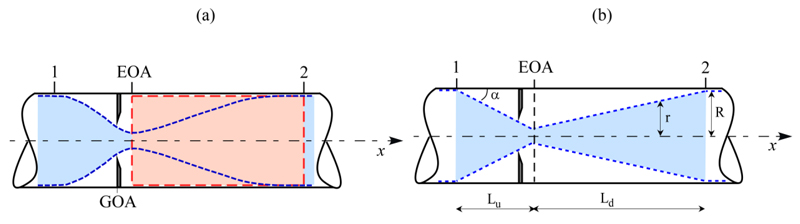
Fig. (2)
Panel (a): the control volume Ω between locations EOA and 2 is shown as a light red area; panel (b): conical contracting and expanding jets adopted to model the transvalvular flow, with adopted notations.