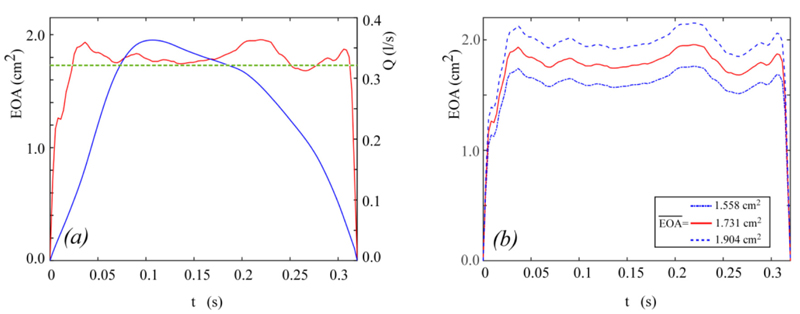
Fig. (3) Panel a: the in-vitro flow rate (blue line, taken from Fig. 4 of [19]) and effective orifice area (red line, taken from [29]) waveforms adopted for the complete unsteady Δpnet model validation. The green dotted line corresponds to the mean effective orifice area according to [19]. Panel (b): EOA(t) waveforms adopted for the sensitivity analysis as  varies.