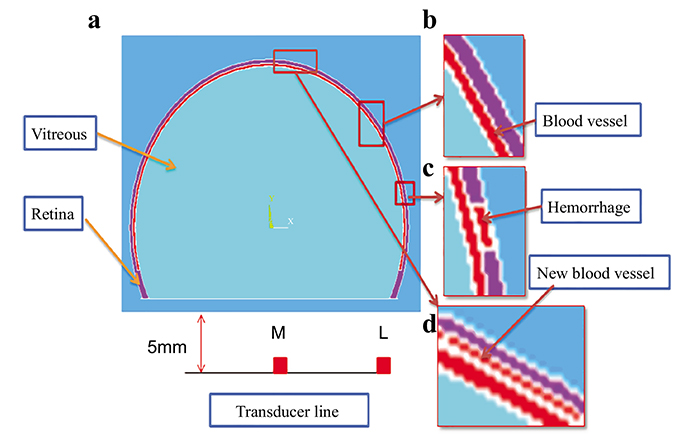
Fig. (2)
(a) A schematic diagram of a 2-D cross-section of the three cases modeled in our simulation and the placement of the line transducer. M and L are the middle and lateral transducer elements where the PA signals will be examined. (b) case1 representing the normal eye, (c) case 2 representing NPDR and (d) case 3 representing PDR.