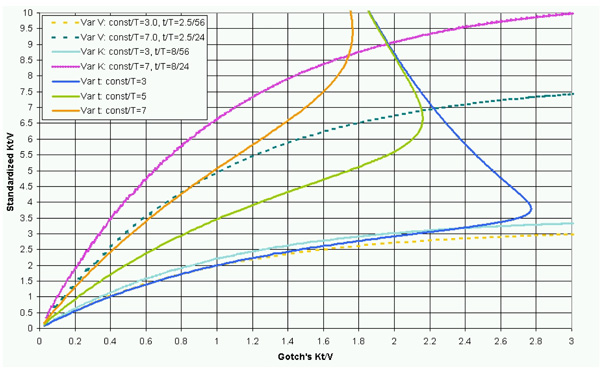
Fig. (11) Standardized Kt/V versus Gotch's Kt/V. There are three sets of curves with constant T values. In the first set (Var V) t=2.5 h, K=259.289 ml/min and V is varied. In the second set (Var K) t=8 h, V=40.6 L and K is varied. In the last set (Var t) V=40.6 L, K=259.289 ml/min and t is varied. One should take note of the fact that the lines of the third set (Var t) cross the lines of the other two sets and represent curves of constant KT/V. All of the Var t curves go to 64.3752 as t/T goes to unity (data not shown), as per Equation . The spread between the three sets of lines increases as t/T increases (compare with Fig. 1) and as Kt/V increases.