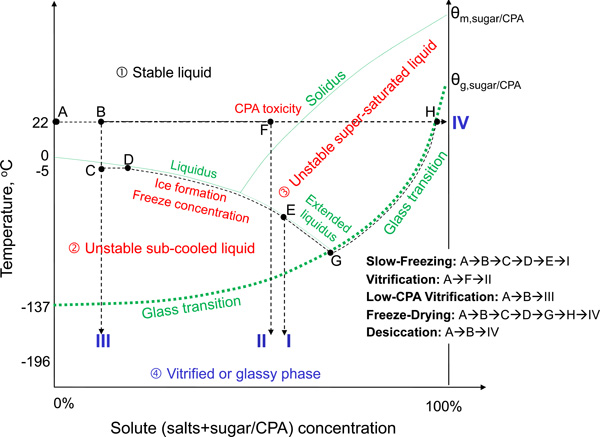
Fig. (3) An illustration on the extended phase diagram of the various approaches to achieve thermal stabilization on biologicals at either cryogenic or ambient temperature from an initial liquid state (A) to a final glassy phase (e.g., I, II, III, or IV): The phase diagram is divided into four thermodynamic regimens by the liquidus, extended liquidus, solidus, and the glass transition curve; the four regimens are the liquid, subcooled liquid, supersaturated liquid, and the glassy phase; cells (in a liquid solution initially) must enter the glassy phase for long-term preservation; CPA represents cryoprotectant, and θg and θm represent the glass transition and melting temperature, respectively. Of note, the diagram is not to scale (for example, the melting temperature of pure CPAs is usually below 20 oC). Figure reprinted from reference [53] with permission from Xiaoming He (the author).