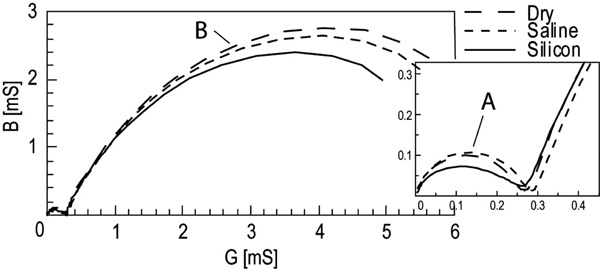
Fig. (8)
Admittance model Wessel-plot of
in vitro
measurement data. Segment
A:
EPI, Segment
B:
Sample. Details from the LF tail inserted.