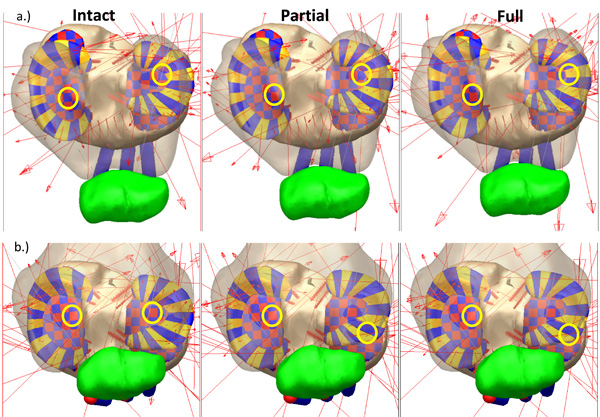
Fig. (7)
Tibia plateau for the three model versions at extension (a.) and flexion (b.) during the forward dynamics simulation. The yellow circles show the location of the peak tibia cartilage contact pressure on the medial and lateral plateaus.