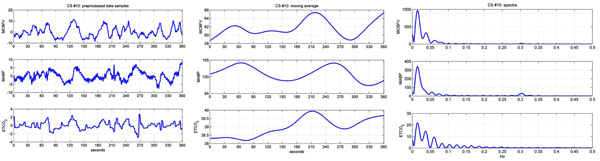
Fig. (1) Left panels: the preprocessed time-series data of MCBFV (first row), MABP (second row), and ETCO2 (third row) for subject #10
over 6 min. Middle panels: the subtracted moving-averages. Right panels: the respective spectra of the preprocessed time-series data up to
0.5 Hz.