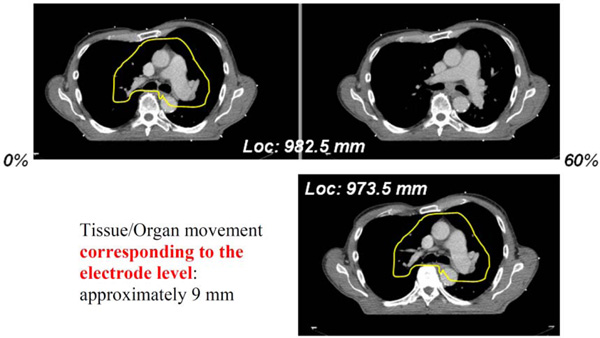
Fig. (7) An example of tissue/organ movements between CT image at FRC+TV (phase of 0%, upper left) and that at FRC (phase of 60%, upper right). The images are from the same transverse location but with different air volumes, 3.17 liter (FRC+TV) vs. 2.65 liter (FRC). We visually examined CT images at other transverse locations to find an image where inside tissue/organ (phase of 60%, lower image) are close to those in the image at FRC+TV. The location difference was measured as tissue/organ movement.