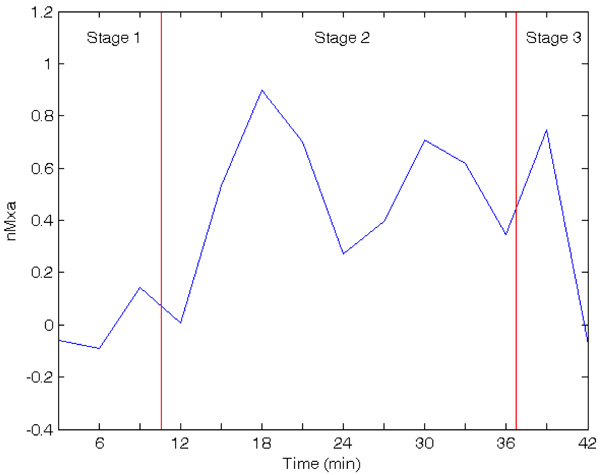
Fig. (4)
The nMxa in three stages of TTT (Blue curve is the correlation coefficient of BP and CBFVchange by time, and red lines divide time into three stages).